


SMARD Energy Insights
Electricity Price Overview
Forecast, Price Factors, and Reality Check against SMARD data. Intelligent use of consumers and storage technology.
The data basis for this page is provided by our SMARD Sparkle heuristic: a calibrated model calculation based on public market and weather data – compared with the SMARD Day-Ahead price from the Federal Network Agency.
Note: The data basis for this page is provided by our SMARD Sparkle Heuristic: a calibrated model calculation based on public market and weather data – compared with the SMARD Day-Ahead Price from the Federal Network Agency. Prototype and heuristic – not financial advice and not an official forecast. Values can change at any time.
What SMARD Sparkle Can Do
SMARD Sparkle is our app for electricity price transparency. The app also provides historical information and an API for verification. Our Smart Energy Insights WordPress plugin can also display this data directly in WordPress.
Forecast
Expected exchange price for the coming hours and days – as guidance for plannable loads.
Price Factors
Which drivers push the price up or down: load, wind, solar, gas, CO₂, and more.
Reality Check
Comparison of our forecast with the actually published SMARD price – over several days.
All three views update automatically from the public API. This way, visitors see live what the model is currently saying – and how close it is to reality.
Electricity Price Forecast
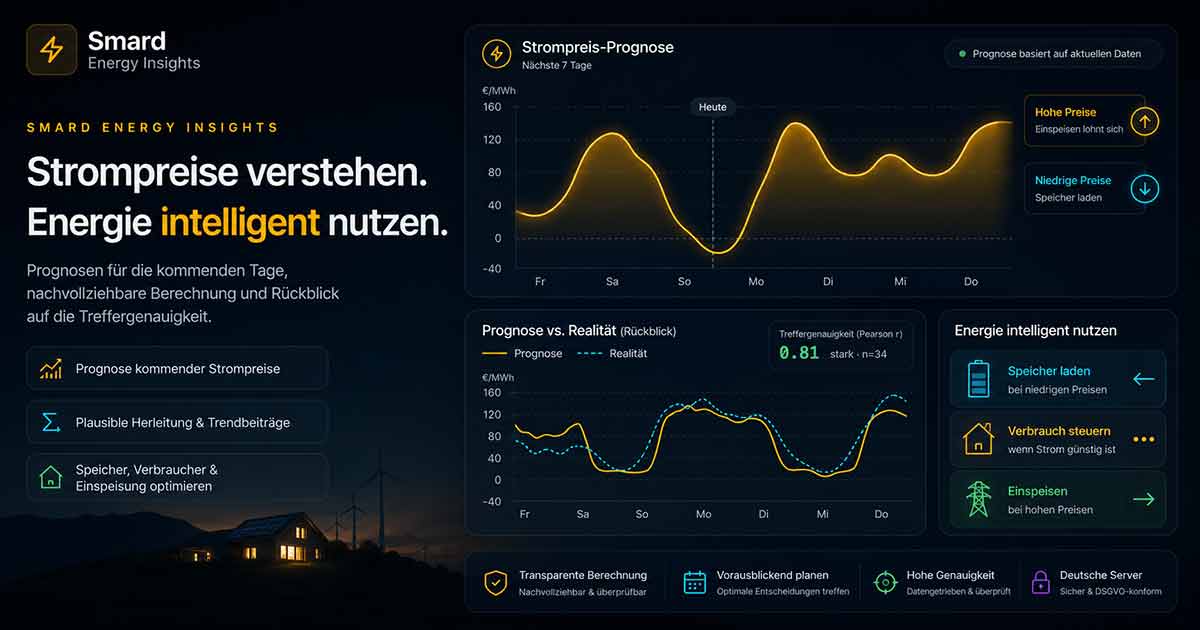
The forecast shows the expected Day-Ahead Price in EUR/MWh for the coming days. Green and favorable phases are suitable for shiftable consumers – expensive peaks warn of load spikes.
Use the timeline in the chart to compare individual hours. The data comes from the SMARD Sparkle heuristic and is regularly recalculated.
How Our Electricity Price is Composed
The exchange price is not a random value. It reacts to supply and demand in the European electricity market. The factors chart breaks down the forecast into individual contributions:
- Load – high consumption drives the price
- Wind & Solar – abundant renewables push the price down
- Gas (TTF) and CO₂ (EUA) – fuel and certificate costs
- FR Nuclear Power and interactions like Solar × Load
Positive contributions are price-driving, negative ones are price-depressing. The sum of all factors plus the base level approximately yields the forecasted hourly price.
Reality Check: Forecast vs. SMARD
Particularly Interesting
Here, our forecast is compared hour by hour with the official SMARD Real Price. Blue represents the prediction, green the reality published later. If the real price is missing, SMARD has not yet provided the data for that hour.
The key figures (Pearson correlation, RMSE, MAE, Bias) show how well the model performs over several days – not just in a single hour. This allows an assessment of whether automatic control can rely on the forecast.
This is the most honest look at our work: not a marketing curve, but a measurable comparison with official data.
Intelligent Use of Consumers and Storage
Smart Energy Insights is not a control tool – but it is the basis for decision-making. Those who understand when electricity becomes cheap or expensive can act strategically:
- Wallbox & EV – Charging during favorable night or midday windows
- Heat Pump & Hot Water – Buffering heat before peak prices arrive
- Home Battery – Storing during surplus or low prices, discharging during expensive hours
- Large Consumers – Shifting production or cooling to cost-effective phases
The reality check shows how reliable this planning is based on our forecast. The more stable the hit rate, the more sensible automatic load shifting becomes.
More details, raw data, and experiments can be found in the SMARD Sparkle App. Official market data is provided by the SMARD platform of the Federal Network Agency.